Nodiux
Mapping the social graph
Discover hidden patterns in Bluesky conversations, identify most influential users and most discussed topics. Designed for researchers, powerful for marketers

Visual network mapping
Don't just read posts, see the connections. Nodiux reveals the hidden patterns and structures behind digital interactions in seconds.
For research and marketing
Effortlessly turn online conversations into interactive network graphs. Map hashtag co-occurrences and reveal the hidden connections between users.
Zero setup, instant results
Search a keyword and visualize the graph immediately. Or upload your dataset and get instant visual insights.
Why visualize networks?
Networks reveal the hidden patterns behind digital interactions. Nodiux brings the power of Social Network Analysis to your fingertips, offering a fast, visual, and intuitive way to map relationships, detect communities, and uncover influence dynamics across social platforms.
Influencer & community mapping
Identify who is really leading the conversation. Our Mentions Network visualizes interactions to help you find opinion leaders, organic communities, and active hubs that simple metrics miss.
Trend and topic intelligence
Understand how topics connect. The Hashtags Network maps co-occurrences to detect emerging trends, campaign resonance, and thematic clusters within the discourse.
User ego networks
Deep dive into specific profiles. Unveil the relational graph surrounding any user to discover how their personal interactions shape their influence and network position.
About Nodiux
Born from a passion for Computational Social Science, Nodiux is designed to democratize network science. We empower researchers, marketers, and journalists to explore the complex structures of decentralized social media without technical barriers.
Nodiux is currently in closed beta. Drop your email to jump in and have a try!
NODIUX
Thank you for joining!
You will receive instructions by email soon.
Introducing Nodiux: a practical tool for network exploration

Since its public launch, Bluesky has attracted millions of users, particularly in moments of turbulence on other platforms like X (formerly Twitter).Bluesky presents a unique opportunity for researchers. ìt’s a rare chance to observe a social network from its formative phase.
How it works
Nodiux is designed to make Bluesky data exploration fast, accessible, and insightful — even for those with limited technical skills. The workflow begins with a simple search based on a hashtag or a username. This triggers the collection of public posts that match the query, typically over the past few days or weeks (depending on availability via the API). Alternatively you could upload your own social media dataset or use the provided template.Once a search is completed, it appears in the dashboard — your personal hub where you can revisit or explore the results in detail.

Post timeline
By clicking on a completed search, you can access a set of detailed statistics. First, a time series chart displays the volume of posts over time for your search term, along with a list of the individual posts—both available for download in CSV and XLSX formats.

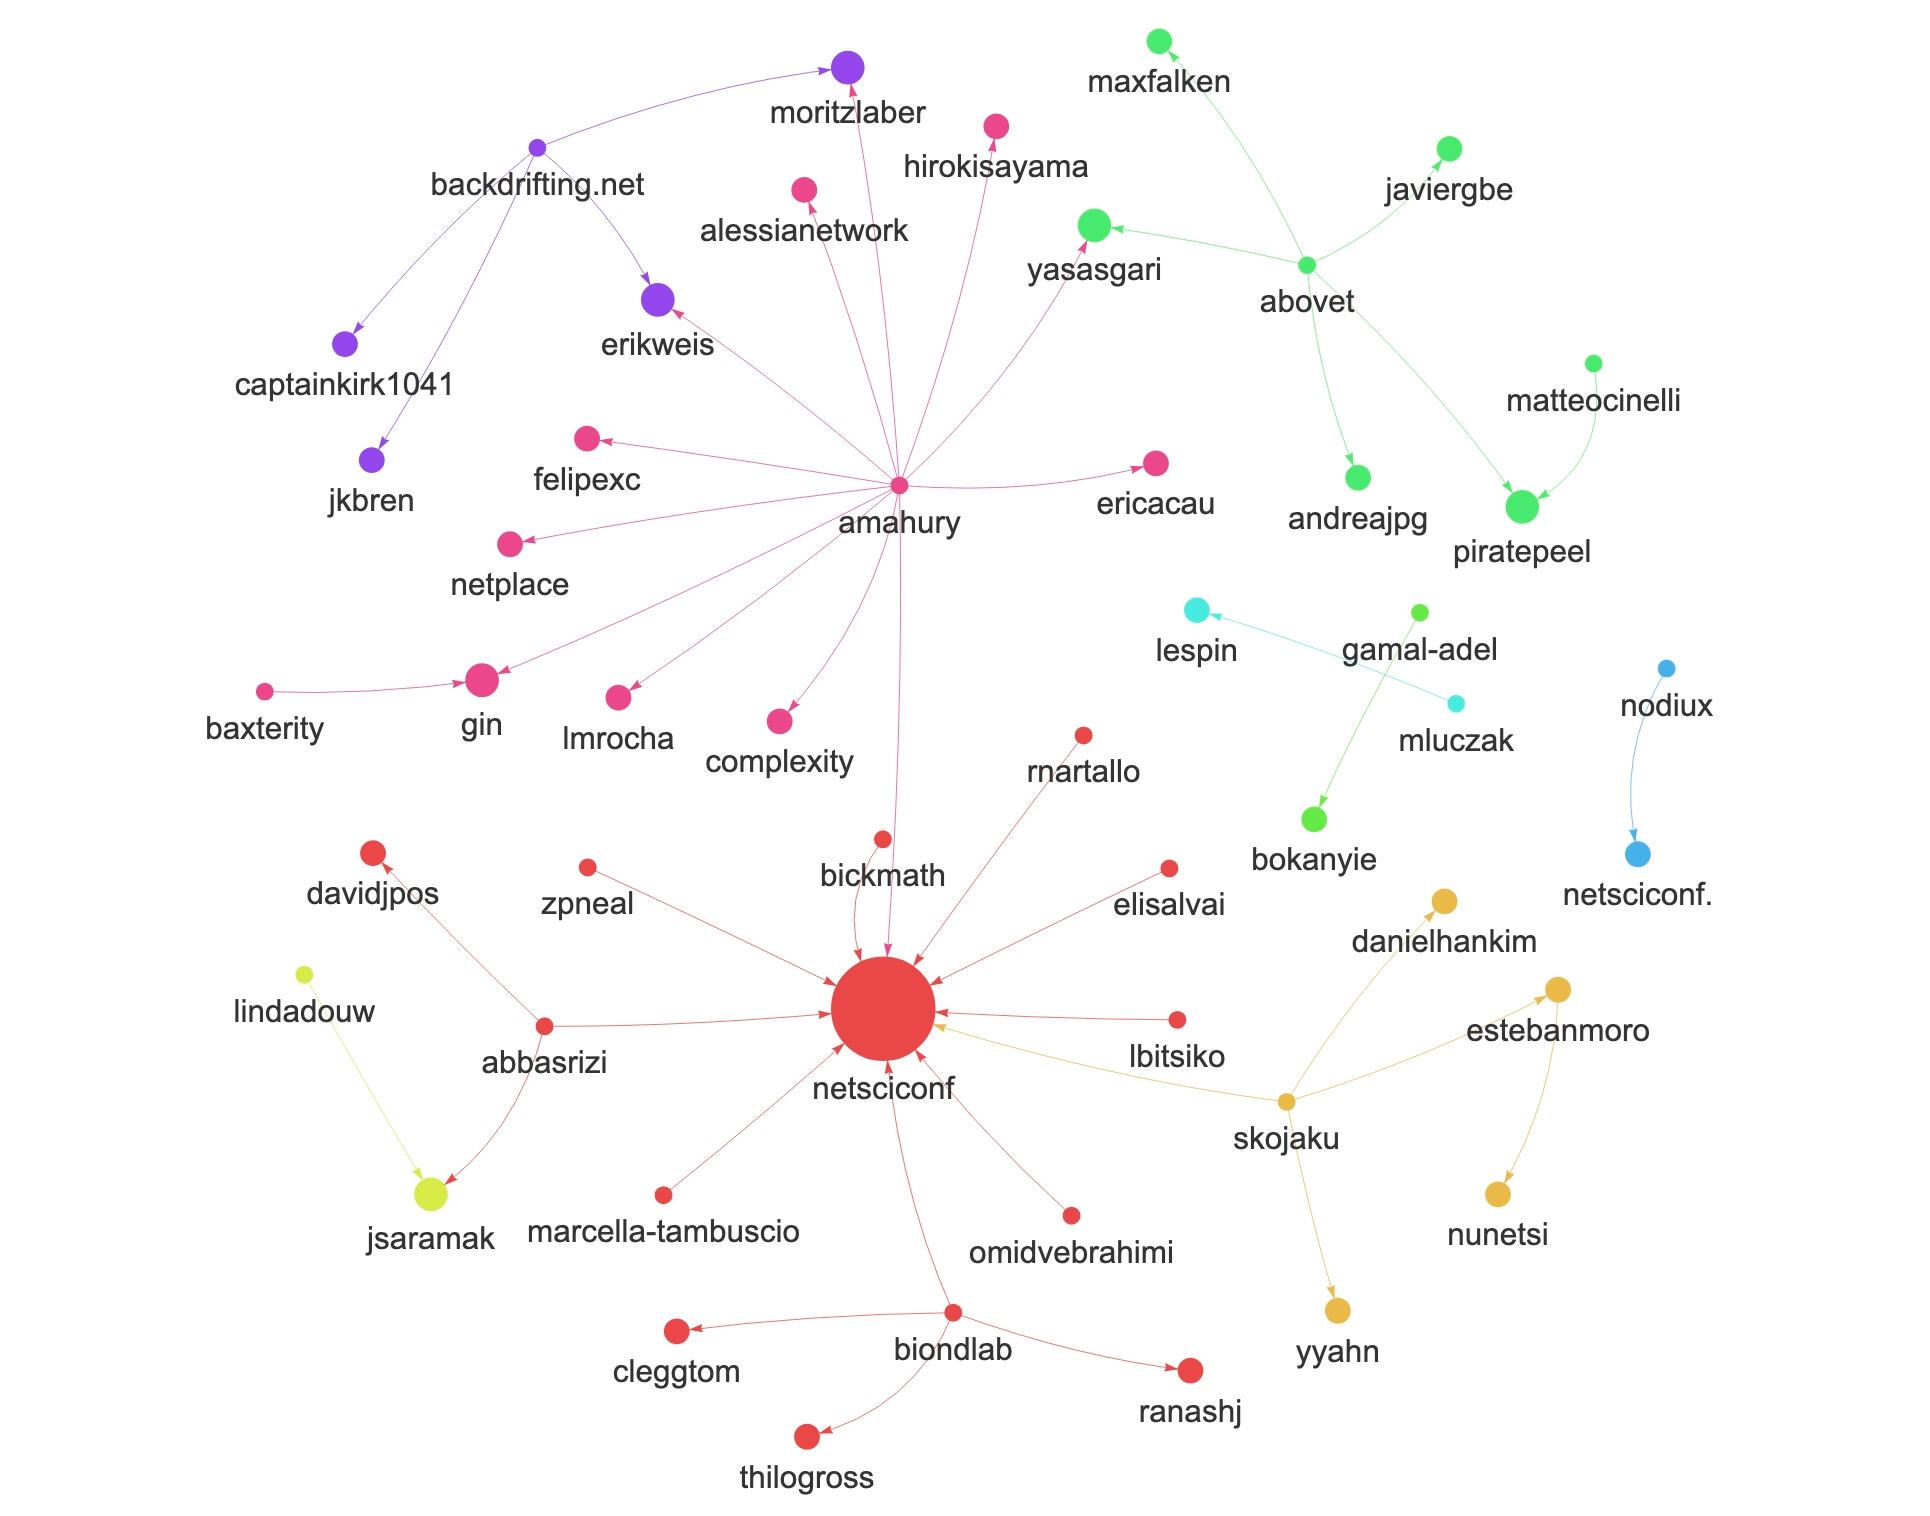
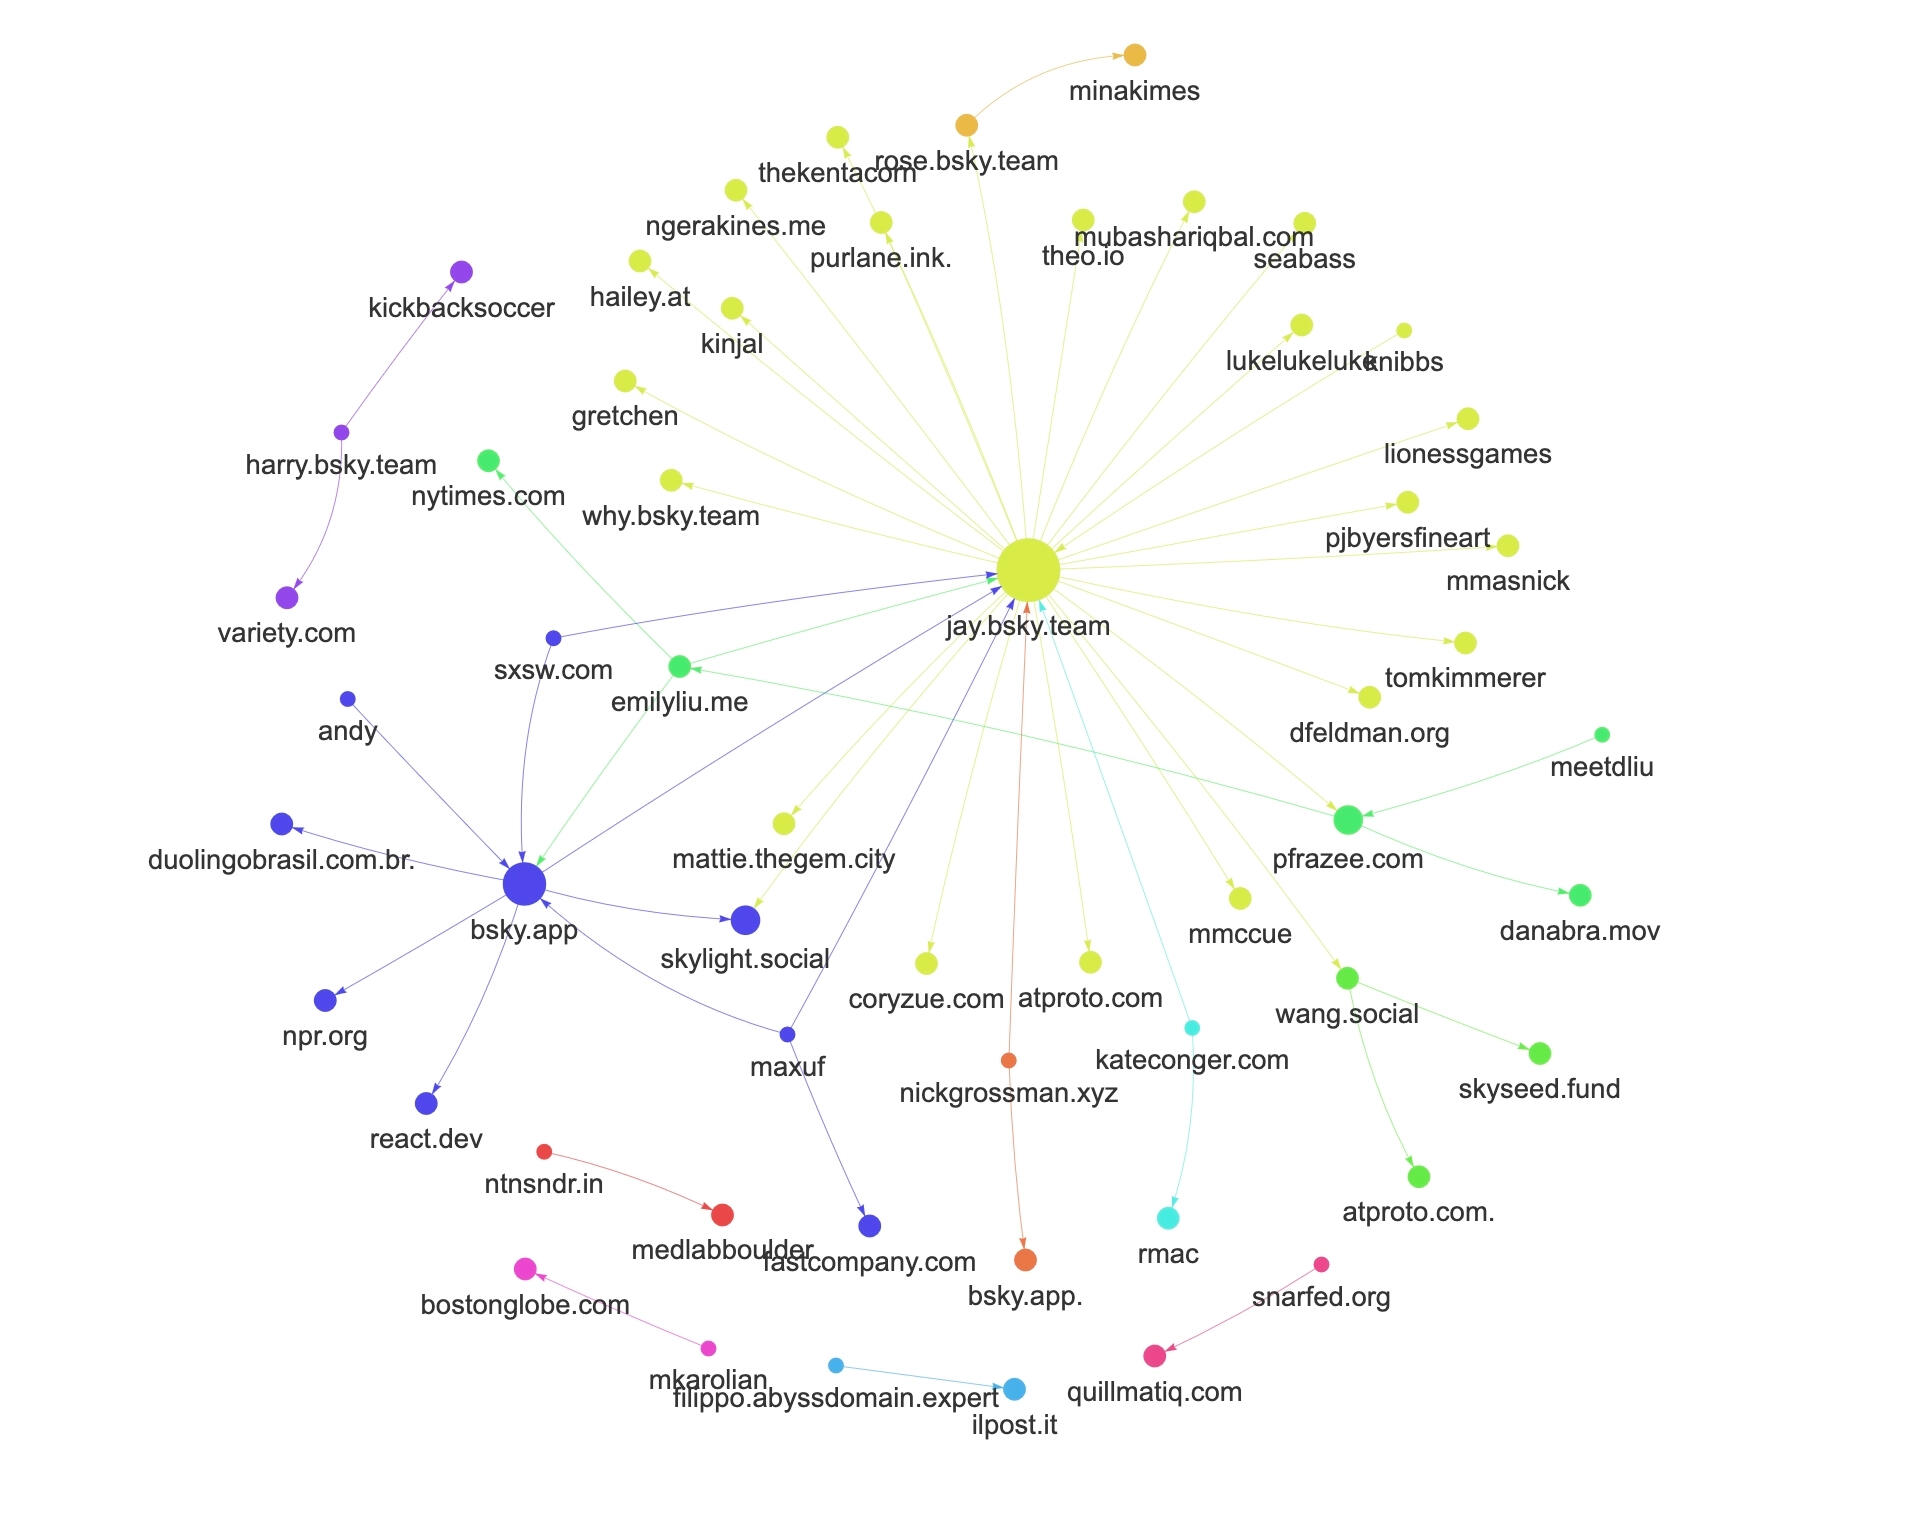
Mentions Network
This is one of Nodiux’s core visualizations: a directed graph where nodes represent users, and edges represent mentions (i.e., user A mentioned user B in a post).
Node size reflects the number of mentions received (in-degree) and the edge thickness is proportional to the frequency of interactions.
Different colors are used to indicate distinct sub-communities within the graph.This network helps identify influencers, conversation hubs, and bridges within the discourse.

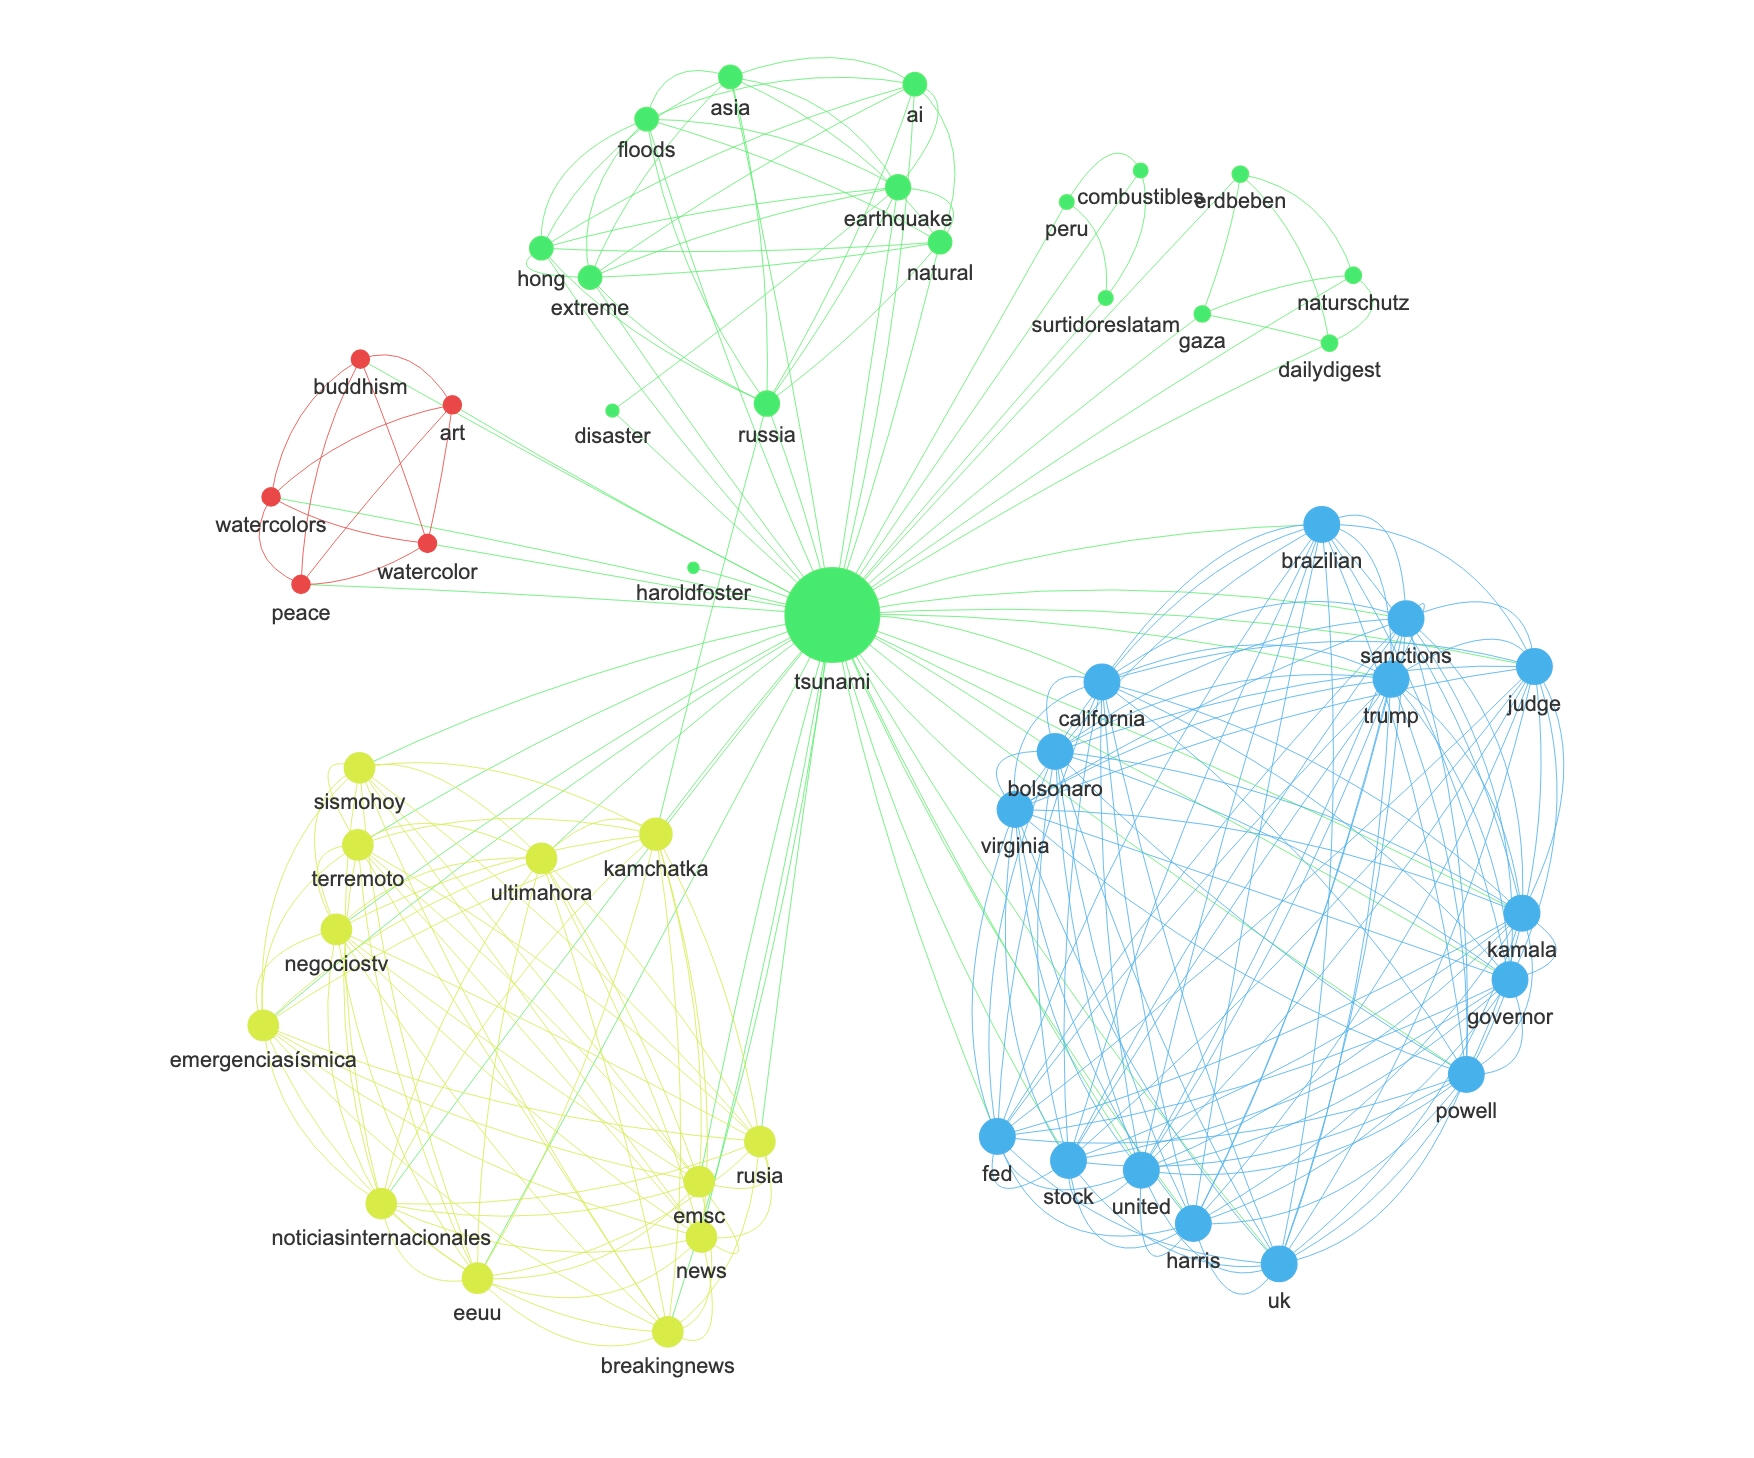
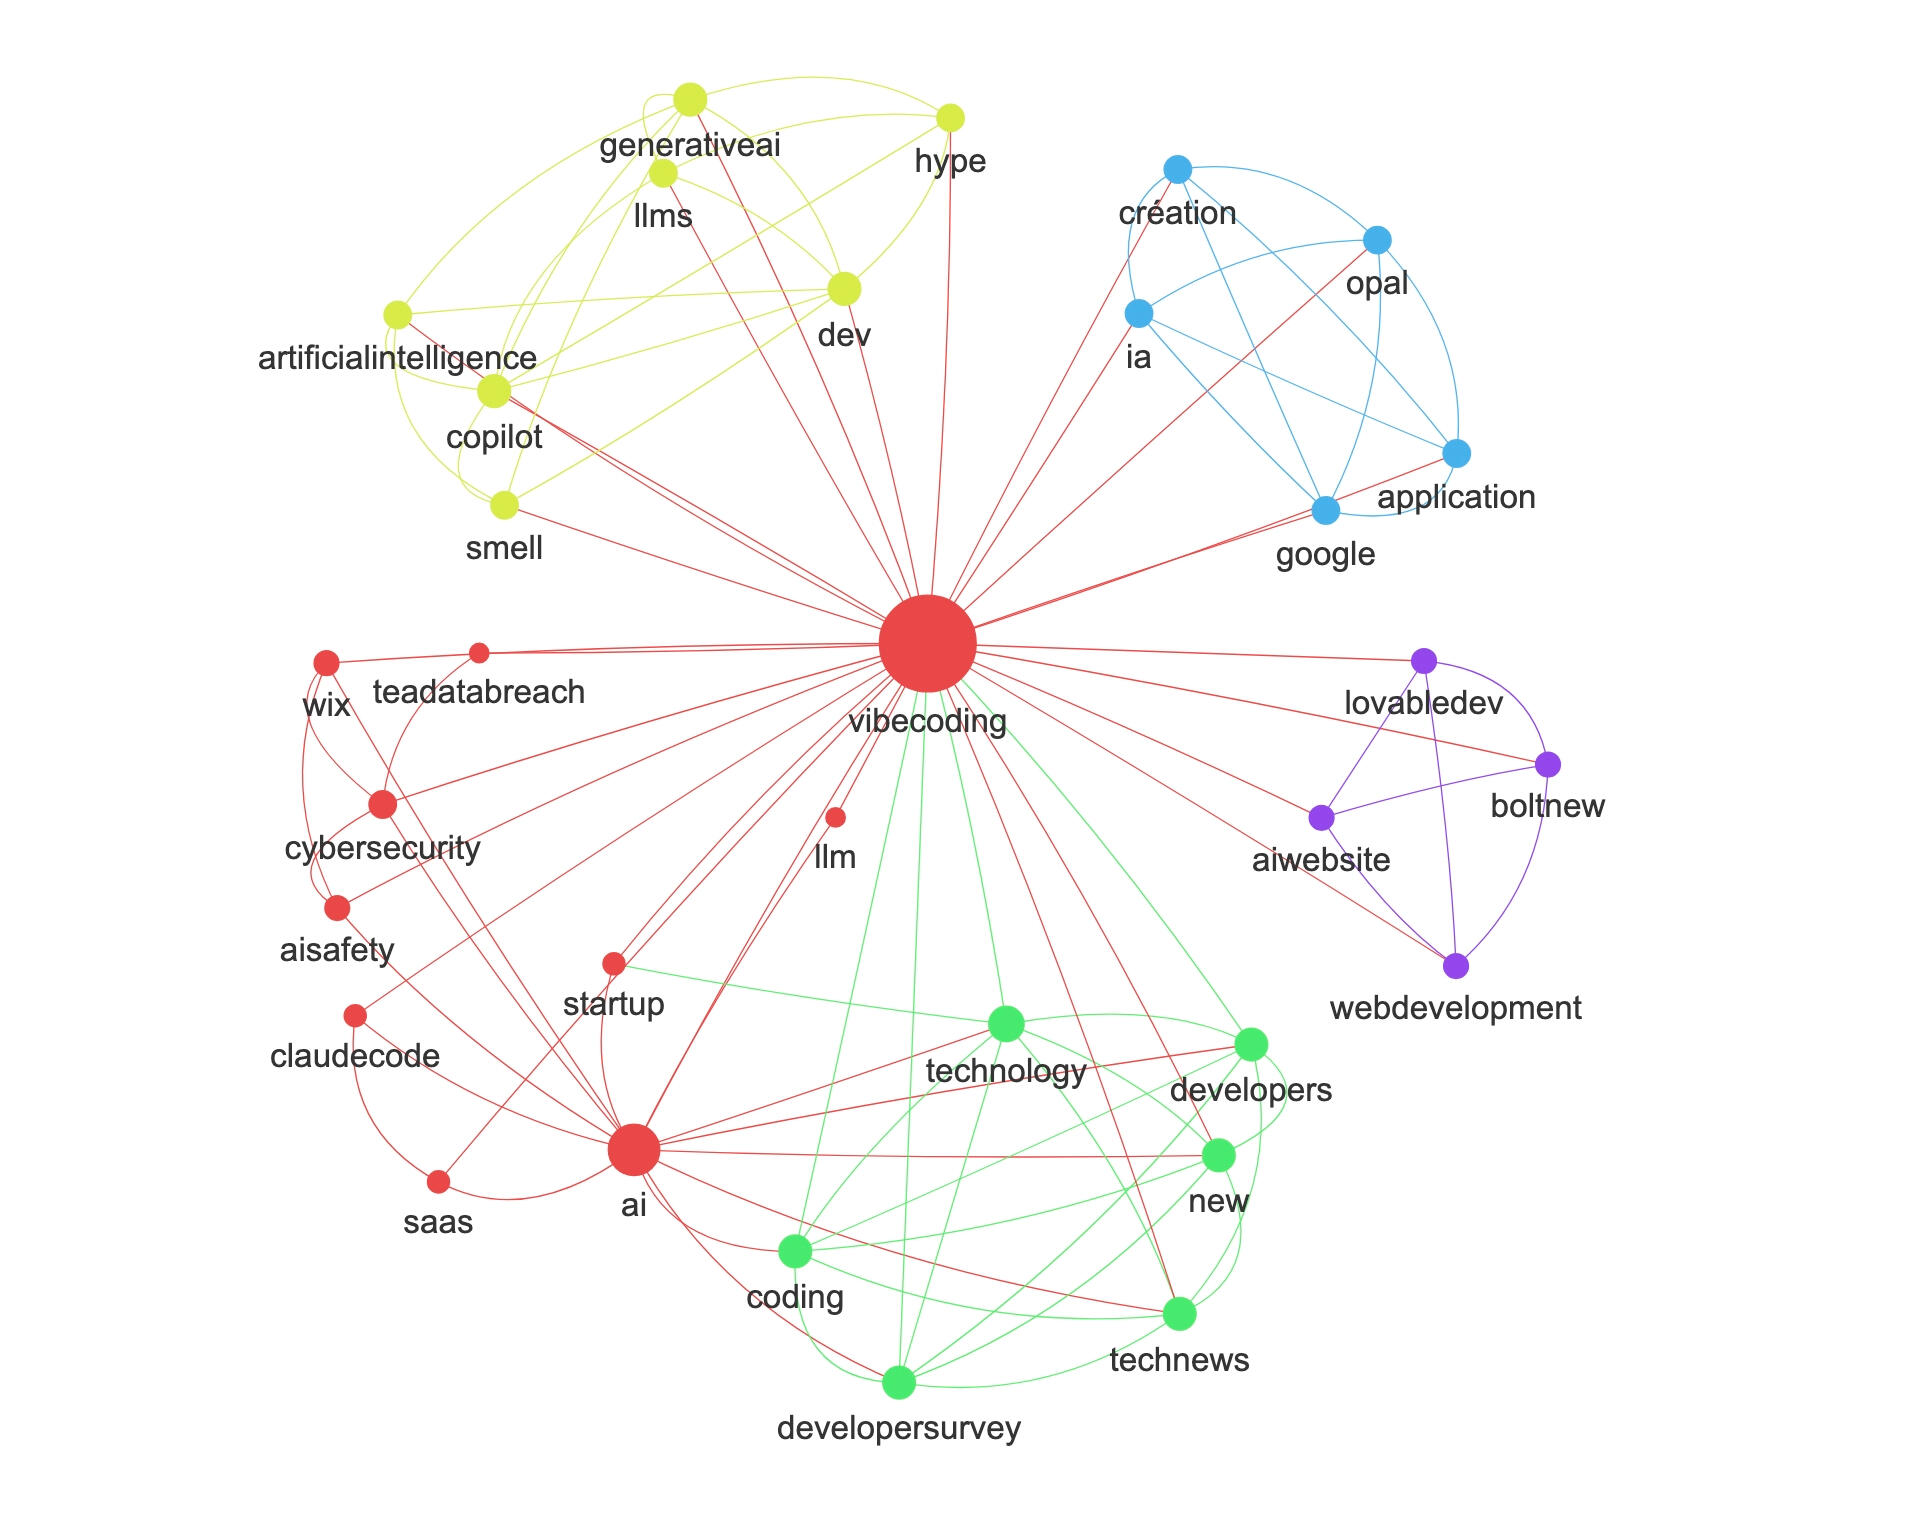
Hashtags Network
The second network representation maps how hashtags appear together in the same posts. Nodes are the individual hashtags and edges represents the co-occurrence frequency. This network is particularly useful for mapping how topics relate to each other and identifying emerging issue areas or coordinated campaigns.

Nodiux is still in beta, and we’re actively working on new features. Want to try? Jump on board.
Nodiux is currently in closed beta. Drop your email to jump in and have a try!
Nodiux privacy policy
Effective Date: 15 August 2025.1.Introduction
Welcome to the Nodiux Privacy policy ("we," "us," "our"). We are committed to protecting your personal data and being transparent about how we collect, use, and store it. This policy explains our practices in compliance with the European Union's General Data Protection Regulation (GDPR).2. Who We Are (Data Controller)
The data controller responsible for your personal data is the Nodiux Team. Contact: [email protected].3. What Data We Collect
Currently, we collect the following personal data through our contact form: First Name, Last Name, Email address.We may also collect other technical data (such as your IP address, browser type, etc.) for security and website analytics purposes.4. Legal Basis and Purposes of Processing
We process your personal data based on your explicit consent, provided by you checking the acceptance box on our contact form. The specific purposes for which we use your data are to send you information about the service launch.5. How We Store Your Data
Your data is stored on secure servers managed by Carrd (website manager) and/or an email marketing service provider (Brevo). We implement appropriate technical and organizational measures to protect your data from unauthorized access, disclosure, alteration, or destruction.6. Data Sharing
We may share your data with:Service Providers: Third parties who help us operate our website and send emails.
Selected Partners: Third parties we collaborate with to offer you information on initiatives that we believe may be of interest to you, in line with your consent. Your data will only be shared for the purposes you have consented to. Legal Authorities: We may disclose your data if required by law, such as in response to a subpoena, court order, or other legal process.7. Your Rights Under GDPR
You have the following rights regarding your personal data:
- Right to access: You have the right to request a copy of your data.
- Right to rectification: You have the right to ask us to correct any data you believe is inaccurate.
- Right to erasure ("right to be forgotten"): You have the right to ask us to delete your data.
Right to restrict processing: You have the right to ask us to restrict the processing of your data.
- Right to data portability: You have the right to receive your data in a structured, commonly used, and machine-readable format.
- Right to object: You have the right to object to the processing of your data for direct marketing purposes.
- Right to withdraw consent: You can withdraw your consent at any time by sending an email to [email protected]. Withdrawing consent will not affect the lawfulness of processing based on consent before its withdrawal.8. Data Retention
We will retain your personal data for as long as necessary to fulfill the purposes for which it was collected, unless you choose to withdraw your consent or exercise your right to erasure. You can unsubscribe from our mailing list at any time.9. Cookies and analytics
This website may use technical cookies that are strictly necessary for its proper functioning. In addition, if enabled, the site may use Google Analytics 4 (GA4) or similar tools to collect anonymous statistical information on website usage, such as the number of visits or the most viewed pages. These analytics tools may set cookies on the user’s device.
No profiling cookies are used. Users can manage or disable cookies through their browser settings at any time.10. Contact Us
If you have any questions or wish to exercise your rights, you can contact the Nodiux team at: [email protected].11. Changes to This Policy
This Privacy Policy may be updated periodically. We will inform you of any changes by posting the new policy on this page. We encourage you to review this policy regularly to stay informed about how we are protecting your data.
Nodiux terms of service
Effective Date: 15 August 2025.1. Scope of the service
Nodiux provides an online platform that allows users to perform research and analysis on data from external sources, such as Bluesky, and to upload their own social media data for processing and visualization. The platform is designed exclusively for analytical purposes and does not serve as a permanent storage or backup service.2. Data responsibility
Users remain the sole owners and responsible parties for any data they upload or generate on the platform. By using Nodiux, users acknowledge and agree that the platform may process such data solely to enable the intended functionality of the service.
Users are solely responsible for maintaining their own copies and backups of all uploaded or generated data. Nodiux does not guarantee the preservation, integrity, or continued availability of any data and shall not be held liable for any loss, corruption, or deletion of such data.3. Limitation of liability
The service is provided on an “as is” and “as available” basis, without any express or implied warranties of any kind, including but not limited to uninterrupted availability, error-free operation, or fitness for a particular purpose.
Nodiux shall not be held liable for:- interruptions, malfunctions, or discontinuity of the service- the nature, accuracy, or consequences of the research performed by users- the content of data uploaded by users- direct, indirect, or consequential damages, including economic losses or damages to third parties, arising from the use of the platform4. Proper use
Users must not use the platform to upload or process unlawful data or data that infringes upon the rights of others or violates applicable laws. Users remain solely responsible for their activities and for the results obtained through the platform.5. Service modifications
Nodiux reserves the right to modify, suspend, or discontinue any part of the platform at any time, without prior notice and without any liability to users.